
Belt Measurement Chart
A belt that fits closes on the middle hole, with room to loosen or tighten. The quickest rule is to buy one or two sizes up from your pants waist size — but measuring a belt you already own is even more reliable. This page gives both methods, size charts for men, women and kids, and a quick calculator.
- Instant download
- Editable Word & Excel
- Print-ready PDF
- 7-day refund
5 files · PDF, DOCX, XLSX
Belt Size Chart Pack
Printable men’s, women’s and kids’ belt size charts, a measuring guide and a family gift size card.
- Men’s chart (PDF)
- Women’s chart (PDF)
- Kids’ chart (PDF)
- + 2 more
$5.00 USD, one-time 5 files · about $1.00 each
- Instant download
- 7-day refund
- Secure checkout by Stripe
7-day money-back guarantee. Full refund within 7 days of purchase, even after you download.
Free sample: Mens Belt Size Chart (PDF, 50 KB)
Belt Size Chart Pack
Printable men’s, women’s and kids’ belt size charts, a measuring guide and a family gift size card.
- Men’s chart (PDF)
- Women’s chart (PDF)
- Kids’ chart (PDF)
- Measuring guide (PDF/DOCX)
- Gift size card (PDF/DOCX)
Formats: PDF, DOCX, XLSX. Instant download after payment (link valid 72 hours, up to 5 downloads). AI-assisted: the templates were drafted with AI help and reviewed and laid out before publishing.
$5.00 USD, one-time 5 files · about $1.00 each
- Instant download
- 7-day refund
- Secure checkout by Stripe
7-day money-back guarantee. Full refund within 7 days of purchase, even after you download.
Free sample: Mens Belt Size Chart (PDF, 50 KB)
Full refund within 7 days — see the refund policy and license.
Free printables
Single sheets you can print right now, no sign-up. The full pack adds every sheet in one download plus the editable files.
 Printable Men’s Belt Size Chart
 Printable Women’s Belt Size Chart
 Printable Kids' Belt Size Chart
 Printable Belt Measurement Guide
 Printable Belt Measurement Chart
Use the belt measurement chart
What’s in the pack
- Printable men’s belt size chart (inches and cm, with letter sizes)
- Women’s belt size chart by dress size and waist
- Kids’ belt size chart by age
- Step-by-step measuring guide with diagram
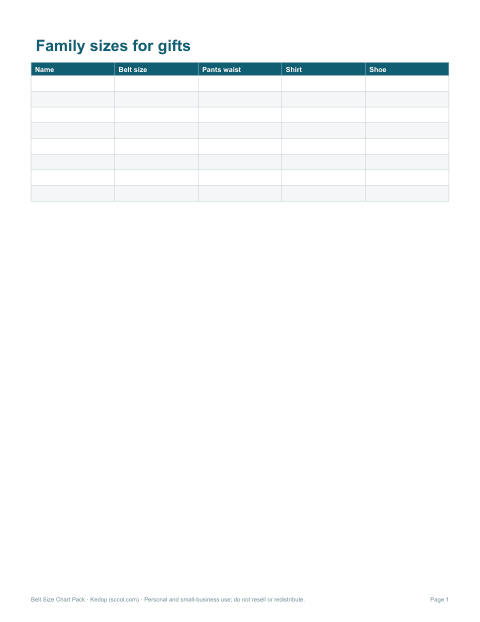
- Gift size card to record family members’ belt sizes
Print on US Letter or A4; keep the gift card in your wallet for shopping.
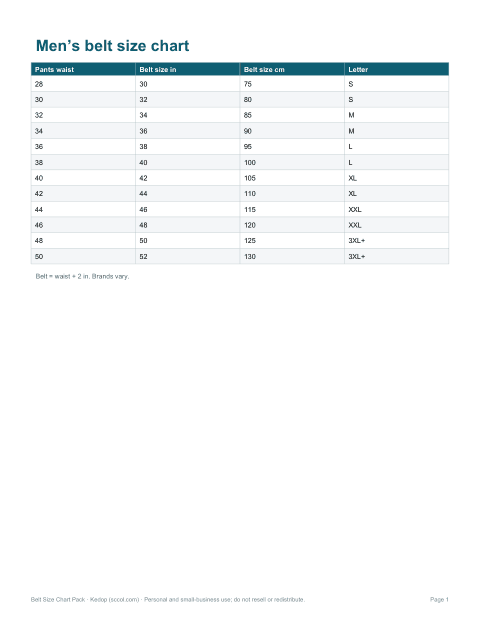
Men’s belt size chart
| Pants waist (in) | Belt size (in) | Belt size (cm) | Letter size |
|---|---|---|---|
| 28 | 30 | 75 | S |
| 30 | 32 | 80 | S |
| 32 | 34 | 85 | M |
| 34 | 36 | 90 | M |
| 36 | 38 | 95 | L |
| 38 | 40 | 100 | L |
| 40 | 42 | 105 | XL |
| 42 | 44 | 110 | XL |
| 44 | 46 | 115 | XXL |
| 46 | 48 | 120 | XXL |
| 48 | 50 | 125 | 3XL+ |
| 50 | 52 | 130 | 3XL+ |
The common rule is belt size = pants waist + 2 inches. Letter sizes vary a lot between brands, so use the number when you can.
Women’s belt size chart
| US dress size | Waist (in) | Belt size | Letter |
|---|---|---|---|
| 0–2 | 24–26 | 26–28 in | XS |
| 4–6 | 27–28 | 29–30 in | S |
| 8–10 | 29–30 | 31–32 in | M |
| 12–14 | 31–33 | 33–35 in | L |
| 16–18 | 34–36 | 36–38 in | XL |
| 20–22 | 37–40 | 39–42 in | 1X–2X |
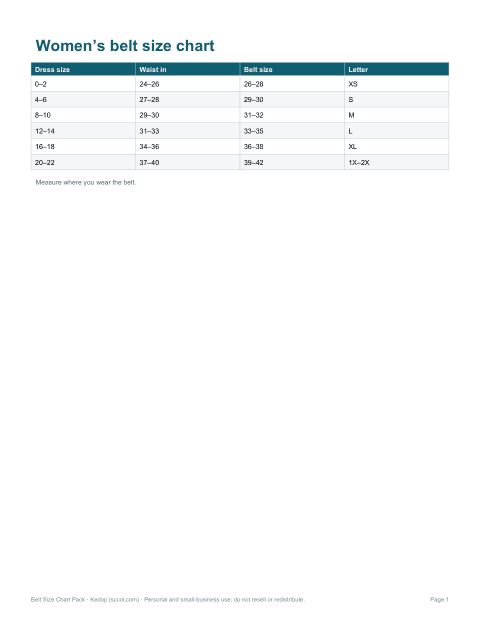
Women’s belts may be worn at the natural waist or on the hips, which changes the size needed — measure where you’ll wear it.
Kids’ belt sizes
| Age | Typical waist (in) | Belt size (in) |
|---|---|---|
| 2–4 | 19–21 | 20–22 |
| 4–6 | 21–22 | 22–24 |
| 6–8 | 22–24 | 24–26 |
| 8–10 | 24–26 | 26–28 |
| 10–12 | 26–27 | 28–30 |
| 12–14 | 27–29 | 30–32 |
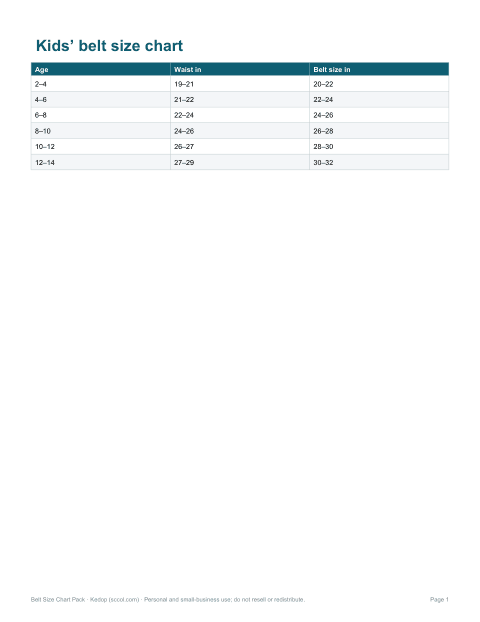
Children vary widely; adjustable elastic belts or belts with extra holes last longer as they grow.
How to measure
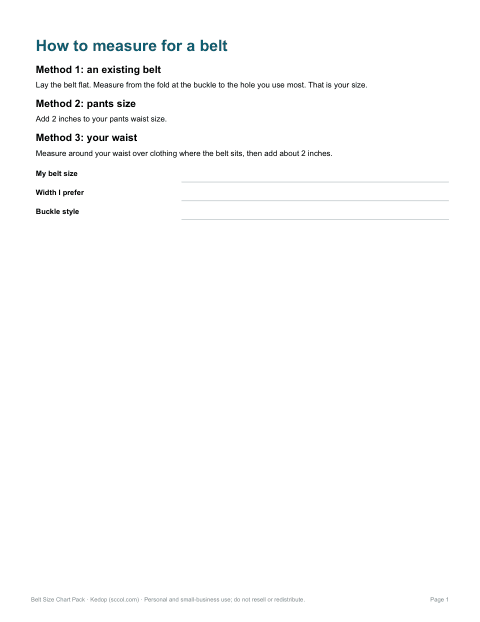
- Existing belt: lay it flat and measure from the fold where the leather meets the buckle to the hole you use most.
- That number is your belt size; if you use the last hole, go one size up.
- Body: measure around your waist over your clothes where you wear the belt, and add about 2 inches.
- Pants: take your pants waist size and add 2 inches.
Don’t measure the belt’s full length including the buckle — that’s not how sizes are labelled.
Worked example
Someone who wears 34-inch-waist jeans adds 2 inches and looks for a size 36 belt — a men’s M in many brands. To double-check, they measure their favourite old belt from the buckle fold to the worn hole: 36 inches. They order a 36, which should fasten on the middle hole with two holes to spare either way.
Belt widths
| Width | Style |
|---|---|
| 1 in (25 mm) | Slim, dress trousers, women’s fashion |
| 1¼ in (32 mm) | Dress and business belts |
| 1½ in (38 mm) | Jeans and casual belts |
| 1¾ in (44 mm) | Work belts, heavy-duty and tool belts |
Check your belt loops: a 1½-inch belt won’t fit narrow dress-trouser loops.
AI-assisted content
These charts were drafted with AI assistance and reviewed before publishing. Sizes are typical conversions; brands vary.
Frequently asked questions
What size belt should I get?
Usually your pants waist size plus 2 inches.
How is belt size measured?
From the buckle fold to the middle hole.
What size belt for 32 waist pants?
A size 34 belt.
Is a size 36 belt a medium?
In many men’s charts, 34–36 is medium — but brands vary.
Can I measure my waist instead?
Yes — measure where you wear the belt and add about 2 inches.
Is this a subscription?
No, the pack is a one-time download.